Light Detection and Ranging (LIDAR) measurements obtained from airborne laser scanning (ALS) provide a representation of land as a cloud of measurement points with defined XYZ coordinates. The files are saved in LAS format and, apart from point coordinates, they also contain, among other things, information on the class of a specific point, or on signal reflection intensity. The points can also be assigned RGB values (reflecting blue, green and red) obtained from aerial images. The following point classes are distinguished in LAS files:
| 0 | – | created but never classified; |
| 2 | – | ground; |
| 3 | low vegetation, i.e. 0–0.40 m; | |
| 4 | medium vegetation, i.e. 0.40–2.00 m; | |
| 5 | high vegetation, over 2.00 m; | |
| 6 | buildings and engineering objects; | |
| 7 | – | noise; |
| 8 | – | water; |
| 12 | – | overlap points. |
Because LAS files are large in size, today, we nearly always use their compressed LAZ format, which is much more convenient and prevents the loss of any original file data.
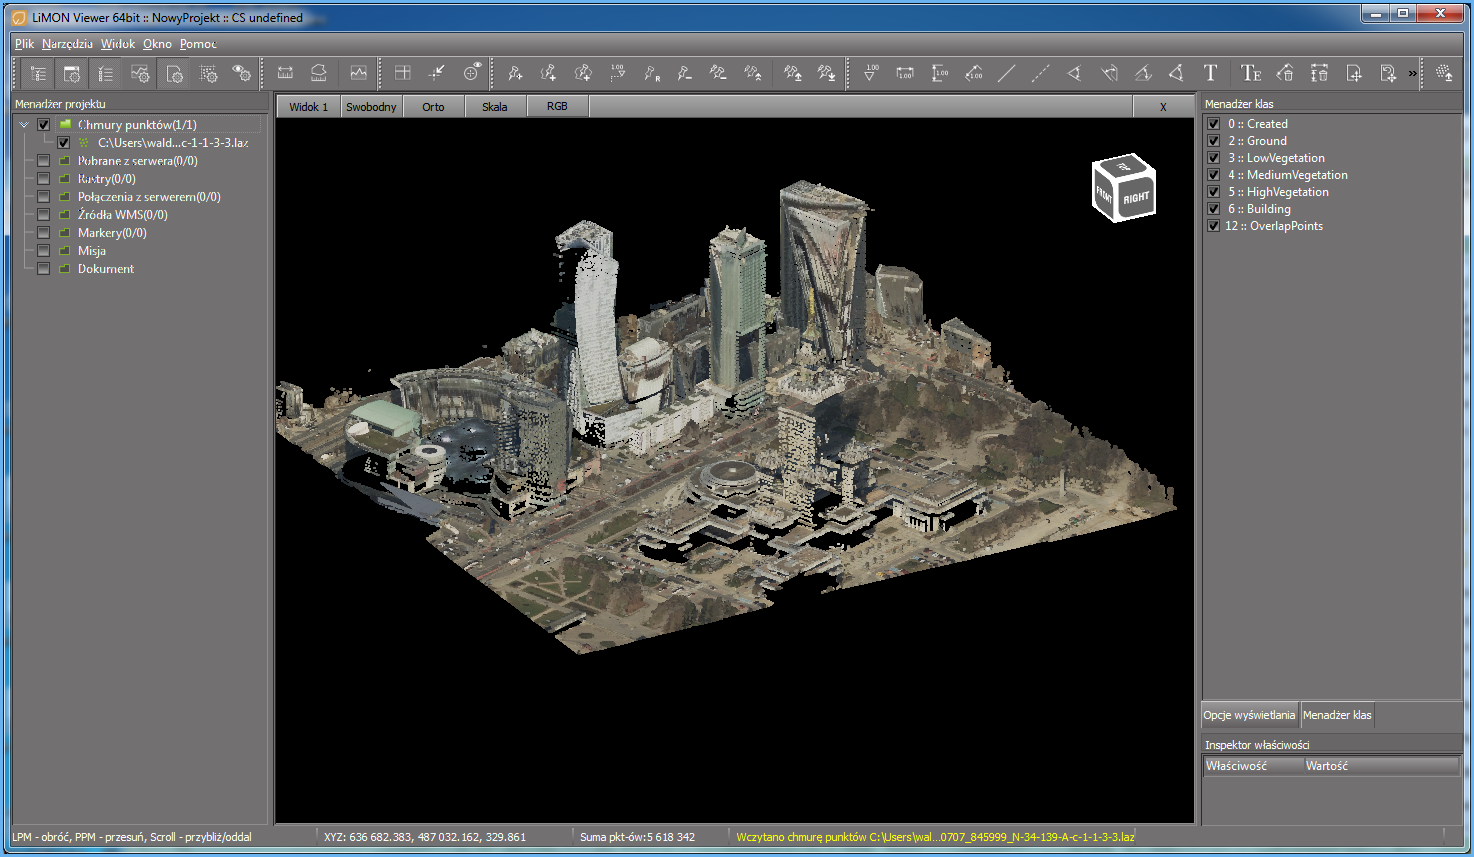
A convenient tool to work with LAS files is LiMON Viewer, which allows users to browse point clouds and carry out some basic analyses. CloudCompare and Fugro Viewer are free applications for point cloud and terrain model visualization.

LIDAR measurements can be used to create and update DEM and DSM but they are also a useful material for analysis. The territory of Poland is covered with ALS data points of various density ranging from 4 points per m2 to as many as 20 points per m2 (in cities).
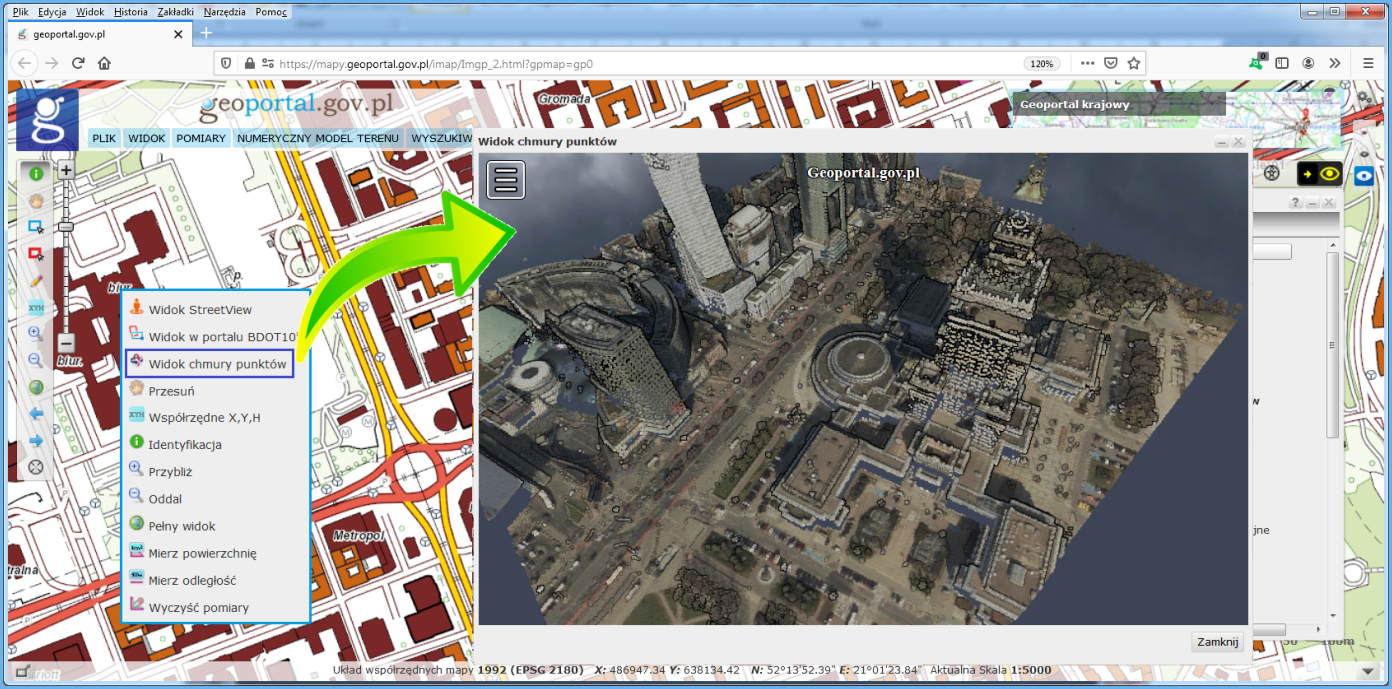
At www.geoportal.gov.pl, you can find a tool for browsing and making simple analyses (e.g. measurements, cross-sections) of data obtained from laser scanning which makes the use of LIDAR measurements easier. To use this tool, zoom in the map on the area of interest, right-click the map and select ,,Widok chmury punktów” ” (View point cloud) from the context menu. The tool loads and displays data corresponding to an LAS data sheet for the clicked location, as illustrated in Fig. 2.
If these functionalities turn out to be insufficient, download raw LIDAR measurements and process them using appropriate software.
LAS file download services
LIDAR measurements in LAS (LAZ) files are provided free of charge and can be used for any purpose. Data can be downloaded from www.geoportal.gov.pl, section “Data for download“, layer group “DEM measurements“. There are two layers in this group: “NMT-PL-KRON86-NH elevation system” and “NMT-PL-EVRF2007-NH elevation system“.
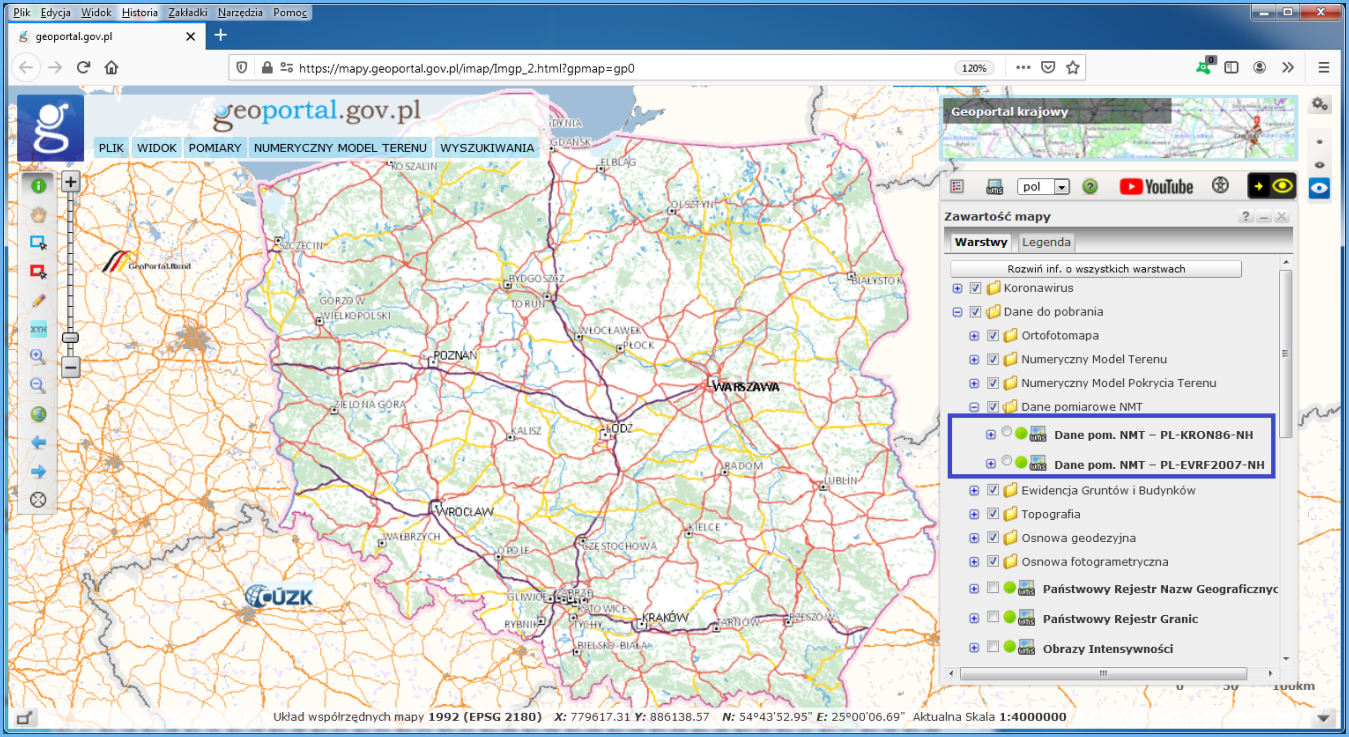
After enabling one of the specified layers and zooming on the area of interest, you will see rectangles which represent LAZ file sections. Click the area of interest to display an option to download the relevant LAZ file, as shown in Fig. 5.
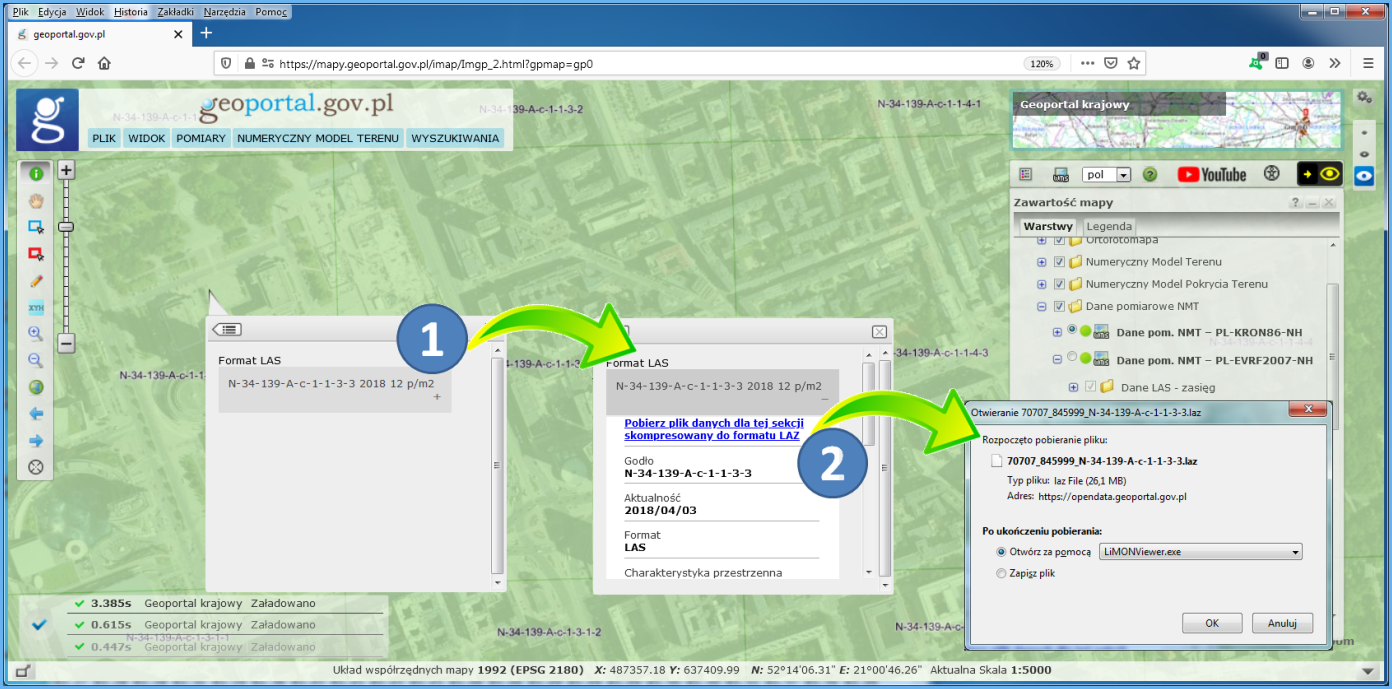
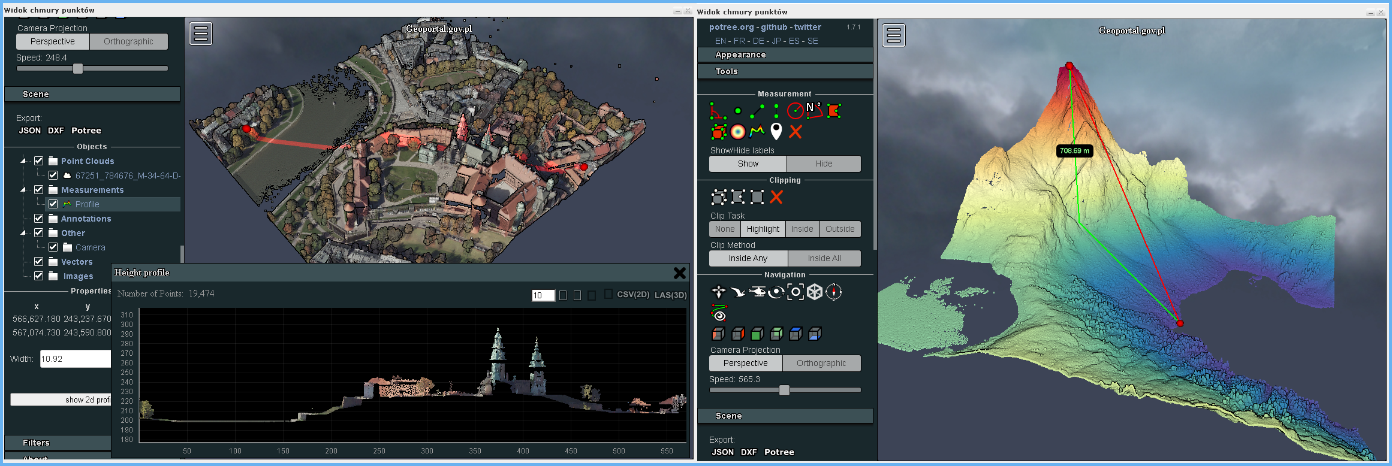
As a result, an LAZ file will be downloaded to your computer, and depending on your decision, displayed in the default application, as illustrated in Fig. 6.
LIDAR measurements at www.geoportal.gov.pl are downloaded via WMS, depending on the elevation system:
- https://mapy.geoportal.gov.pl/wss/service/PZGIK/DanePomNMT/WMS/SkorowidzeWUkladzieKRON86
- https://mapy.geoportal.gov.pl/wss/service/PZGIK/DanePomNMT/WMS/SkorowidzeWUkladzieEVRF2007
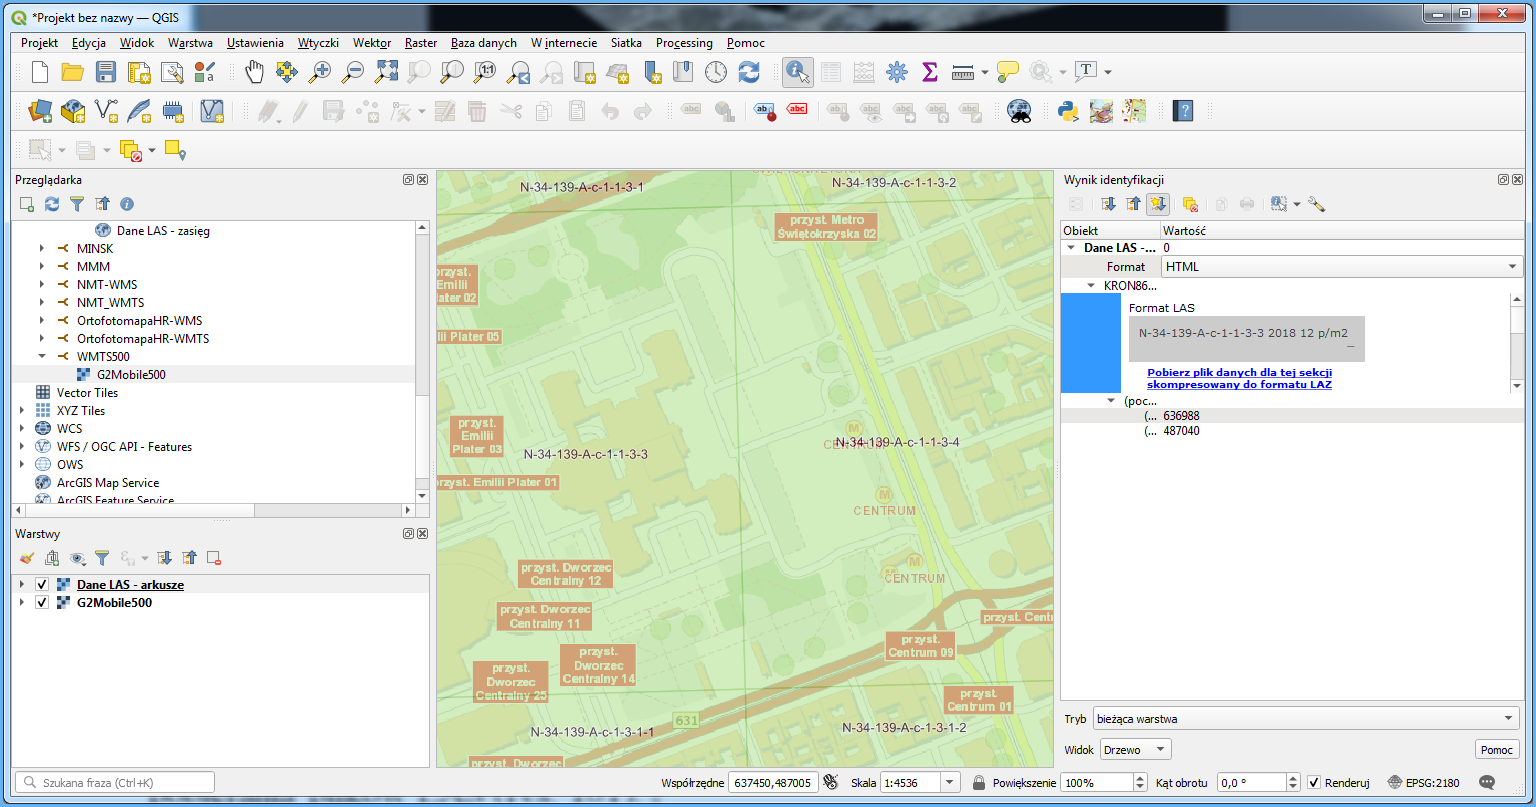
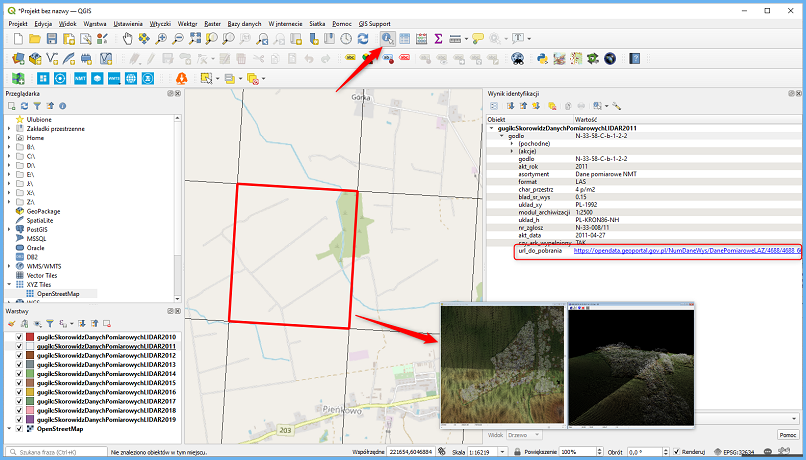
Specifically, the GetFeatureInfo feature is used for this. It shares a link to download the relevant LAZ file as an attribute in the clicked location. If you connect these services to QGIS or other software, you can use such software to directly download LAZ files (Fig. 7).
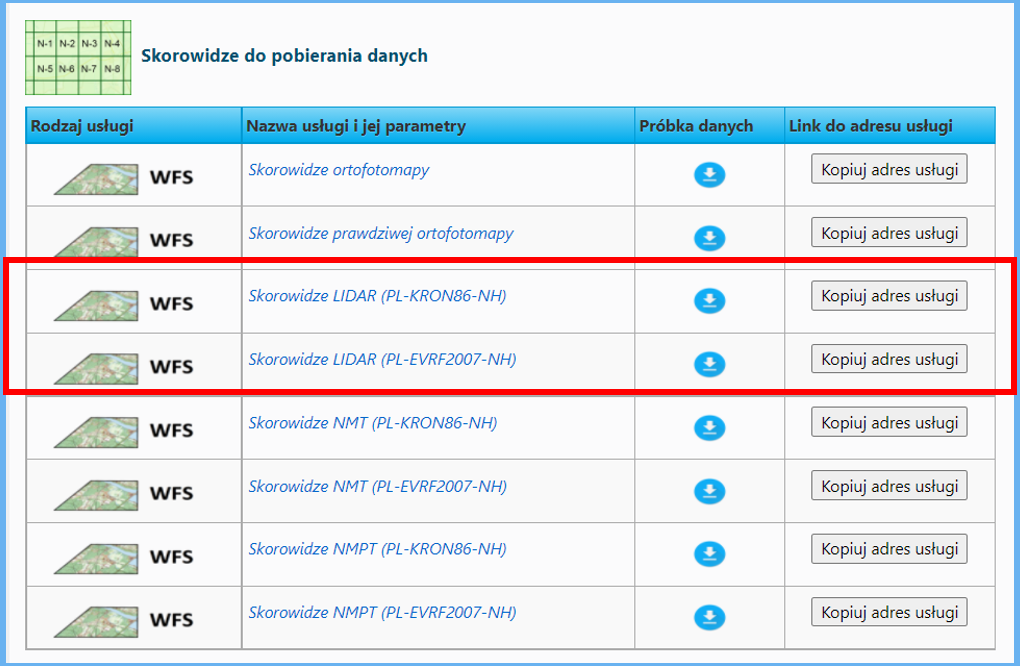
Another service available for the LIDAR data is WFS, which displays data indexes available in the National Geodetic and Cartographic Resources, divided into two elevation systems:
- The first one presents LIDAR measurements per each year (from 2011 to 2019) in the PL-KRON86-NH elevation system.
- The other one presents LIDAR measurements per each year (from 2018 to 2020) in the PL-EVRF2007-NH elevation system.
You can download LIDAR measurement indexes using any software that supports a WFS client feature, such as QGIS. You can easily download each LIDAR measurement sheet from a displayed sheet index. This operation is supported by the „Informacja o obiekcie” (About object) tool which, when you click the selected sheet, will display its metadata, including „Link do pobrania” (Link for download) that you can use to download the LIDAR measurements.
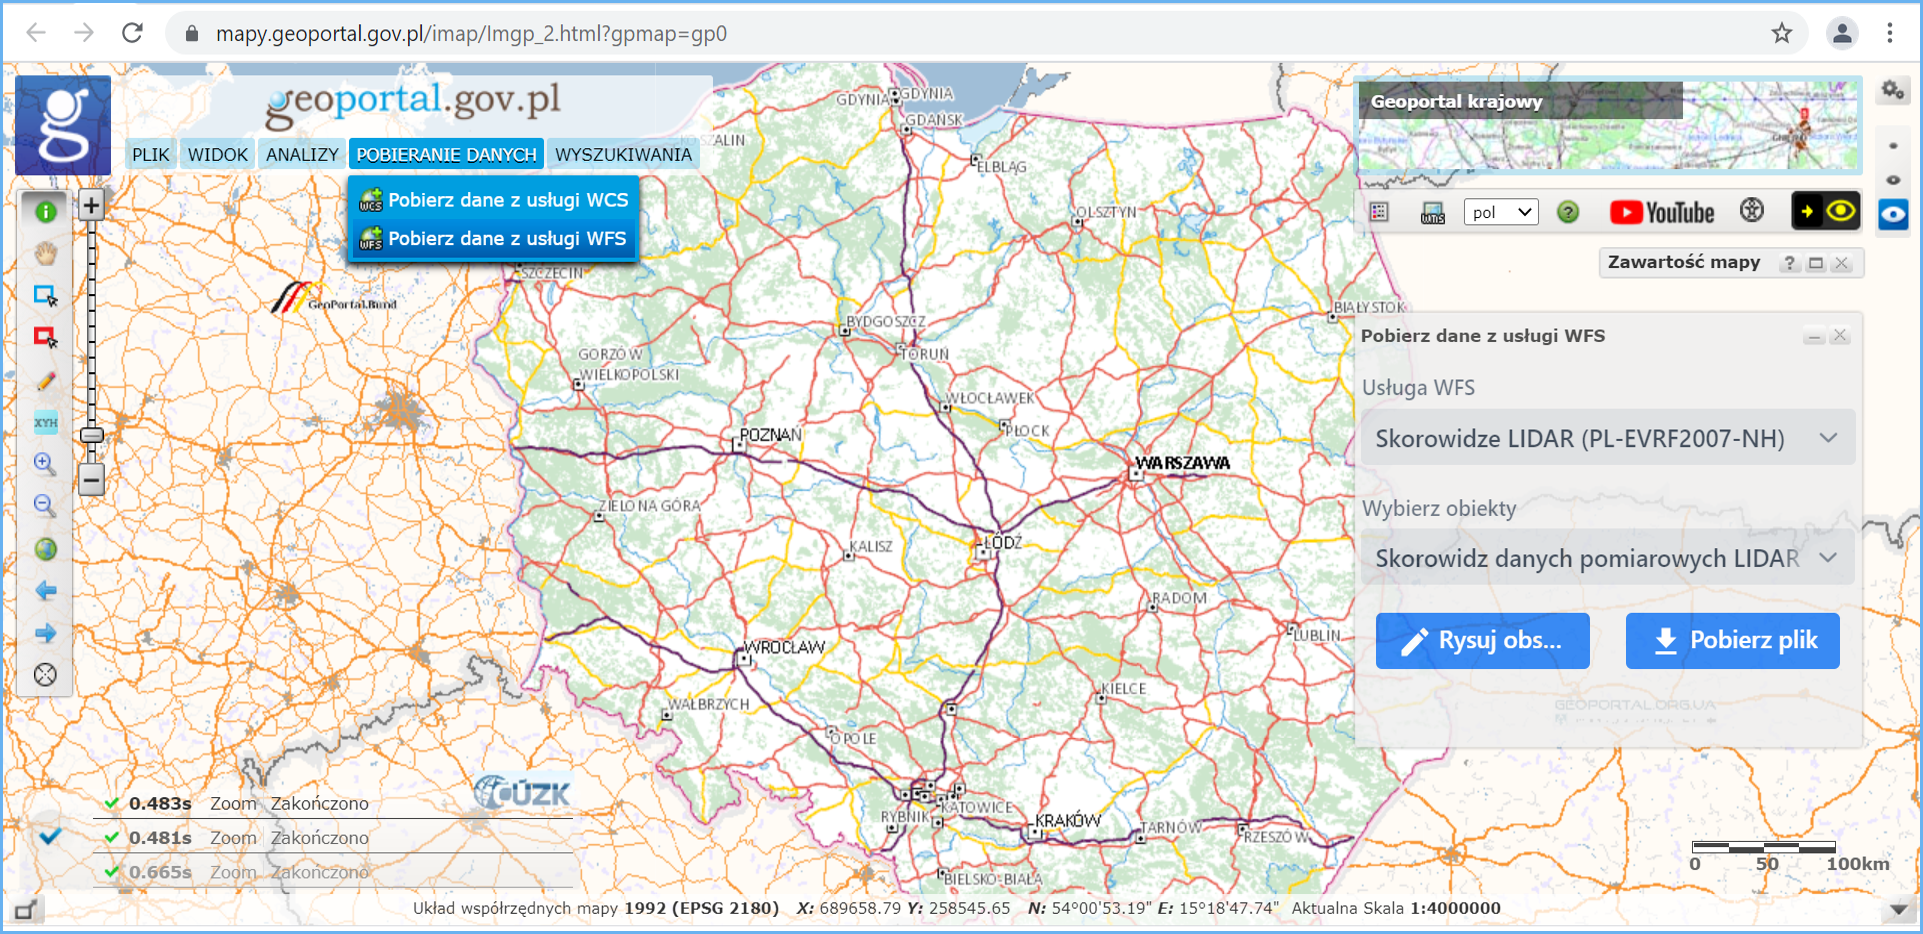
Indexes can be also downloaded via WFS directly from www.geoportal.gov.pl using the „Pobierz dane z usługi WFS” (Download data from WFS service) tool. You can find this functionality on a toolbar in the left part of the map application user interface, as illustrated below.