The Digital Elevation Model (DEM) is a discrete (point-based) representation of land surface elevation. It uses an interpolation algorithm to calculate the elevation at any point of a surface covered by the constructed model. Generally, there are two basic types of DEM based on different geometric structures:
GRID – model based on a regular square mesh;
TIN – model based on an irregular triangle mesh.
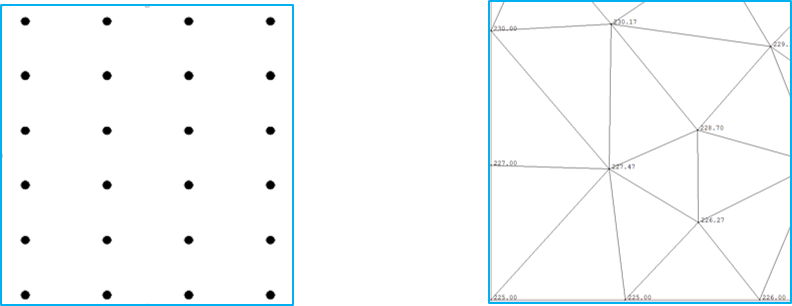
Each of these models has specific advantages and disadvantages which determine their applications. The essence of the TIN model is e.g. storage of original measurement data, while in the GRID model, elevations at nodal points are mostly assigned interpolated values.
In Poland, the basic digital elevation model is based on a 1 m × 1 m mesh. It is systematically updated in line with airborne laser scanning (ALS) results, and, for urban areas, also in line with stereoscopic measurements taken as part of works on the orthophotomap with a pixel size of 10 cm or less. The DEM is also generated based on a 5 m × 5 m mesh in line with stereoscopic measurements taken as part of works on the orthophotomap with a pixel size of 25 cm.
As you can easily calculate, 1 km2 of DEM based on a 1 m × 1 m mesh contains 1,000,000 points. The overall area of Poland is 312,696 km2, which gives 312,696,000,000 points, that is nearly 313 billion points of a defined elevation. These points can be used to calculate terrain elevation at any specific point by interpolation.

Pursuant to the Geodetic and cartographic law act, the person responsible for the maintenance of the DEM database is the Surveyor General of Poland.
DEM data browsing services
DEM data can be browsed using WMS and WMTS which are by default connected to www.geoportal.gov.pl. However, these services can also be connected to any software that supports WMS and WMTS standards.
Information on all services related to the DEM managed by the Head Office of Geodesy and Cartography can be found in the main menu of www.geoportal.gov.pl under tab „Services / View services (WMS and WMTS)” (Fig. 3).
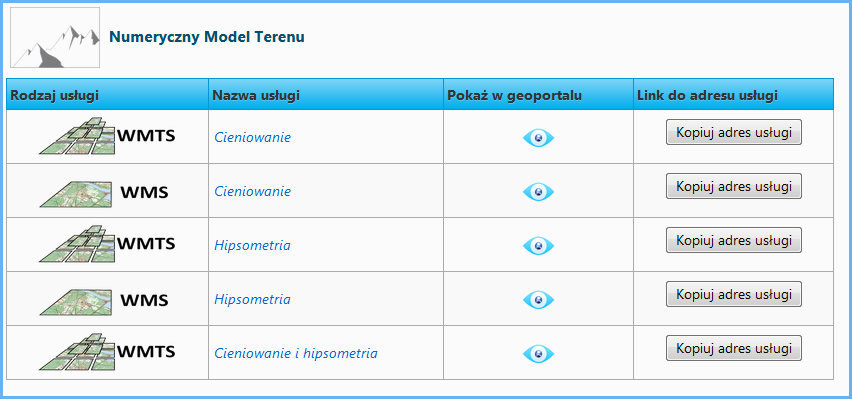
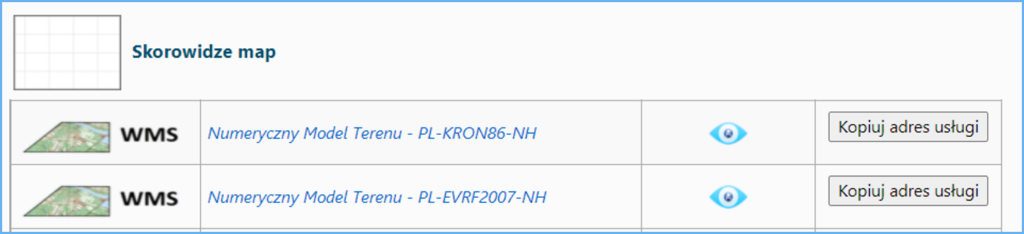
In terms of DEM, WMS and WMTS are key services which present DEM as shading models:
- https://mapy.geoportal.gov.pl/wss/service/PZGIK/NMT/GRID1/WMS/ShadedRelief
- https://mapy.geoportal.gov.pl/wss/service/PZGIK/NMT/GRID1/WMTS/ShadedRelief
Fig. 4 shows a typical image acquired from DEM-related services.
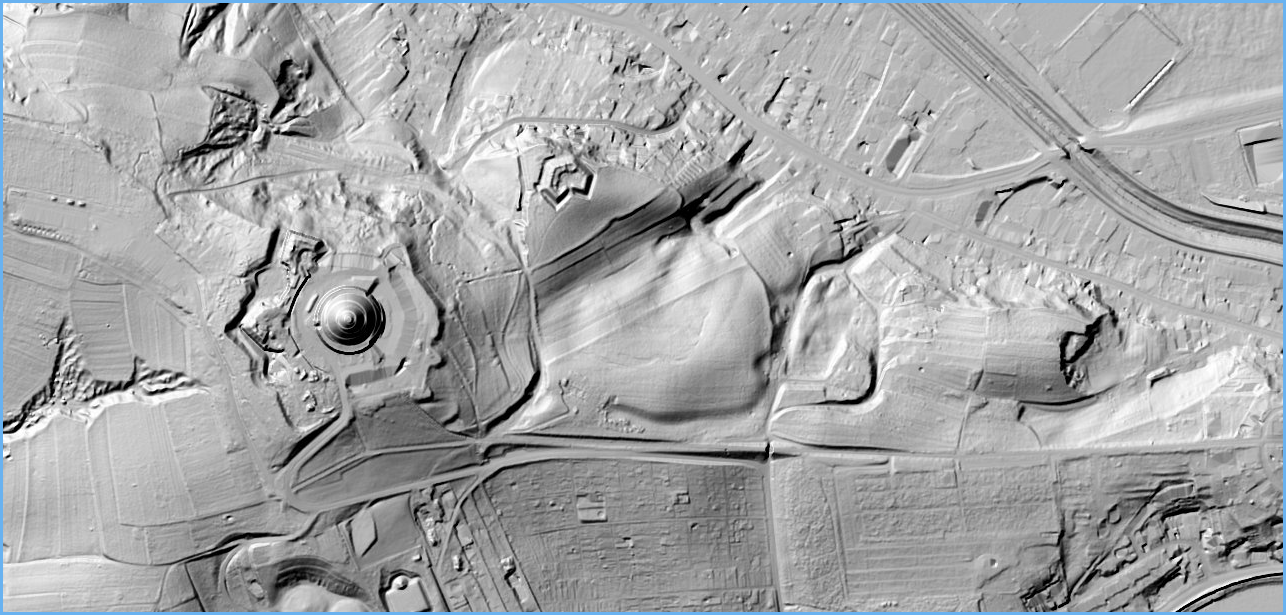
The image shown in Fig. 4 is generated via WMS using a query.
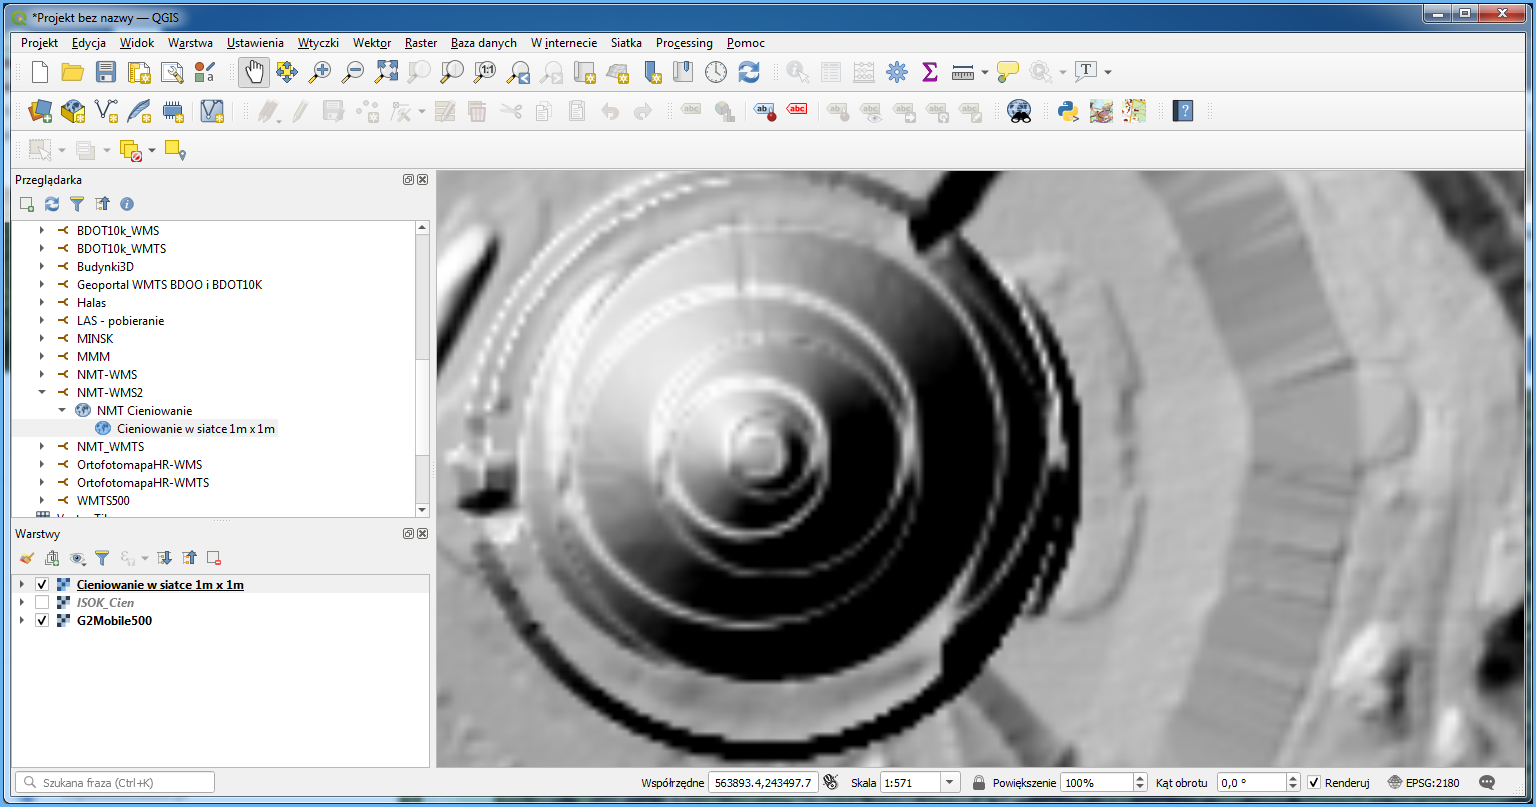
Fig. 5 shows WMTS related to the digital elevation model and connected to QGIS.
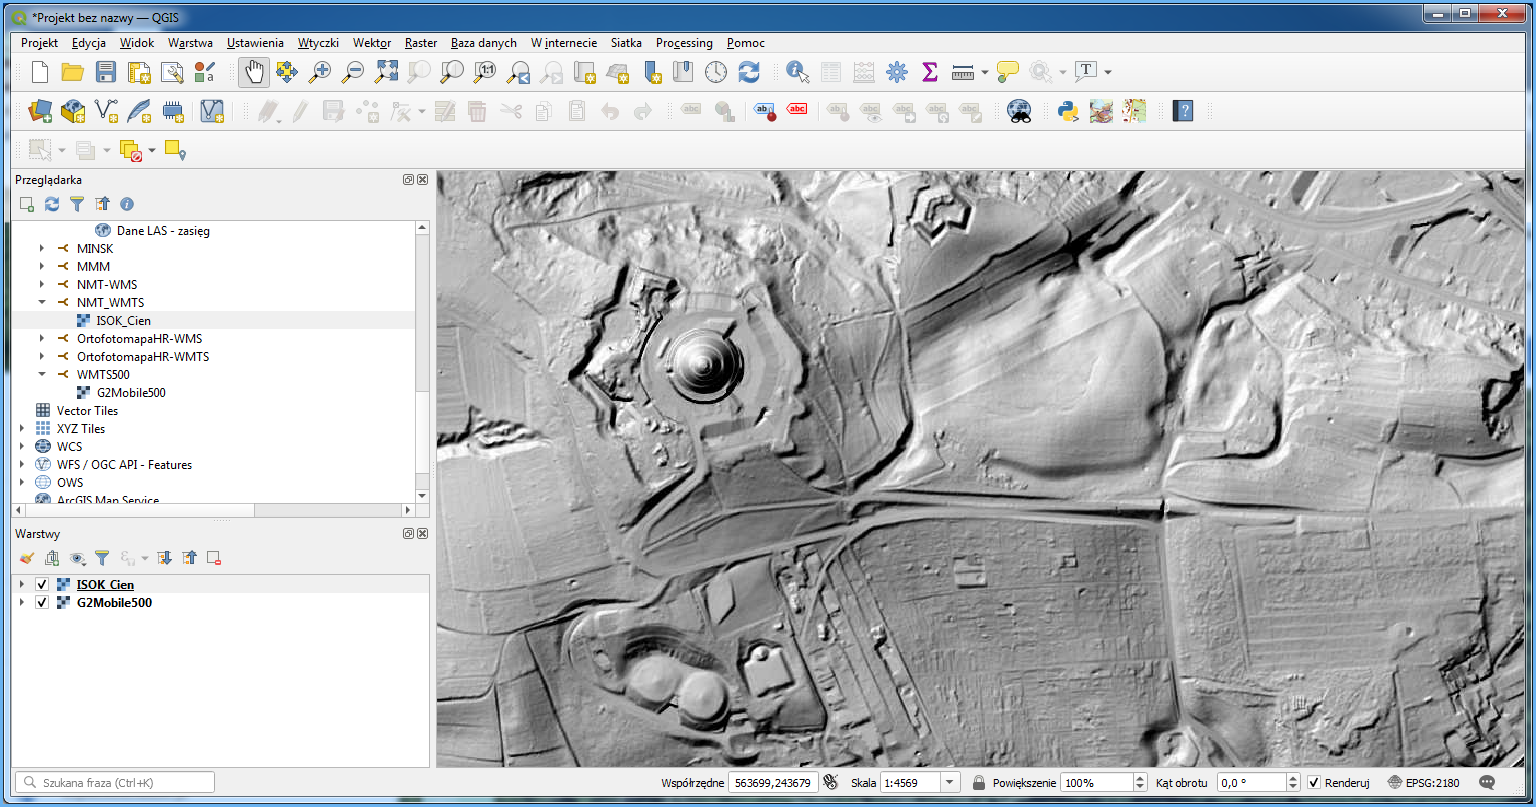
Because WMTS uses prepared tiles adjusted to the 1:500 scale, at higher magnifications, the image can be blurred. If this is the case, try to use WMS as an alternative because this service uses direct access to original DEM data and generates images based on it.
DEM downloading services
DEM data is provided free of charge and can be used for any purpose. Data can be downloaded from www.geoportal.gov.pl, section “Data for download“, layer group “Digital Elevation Model“. There are two layers in this group: “NMT-PL-KRON86-NH” and “ NMT-PL-EVRF2007-NH“.
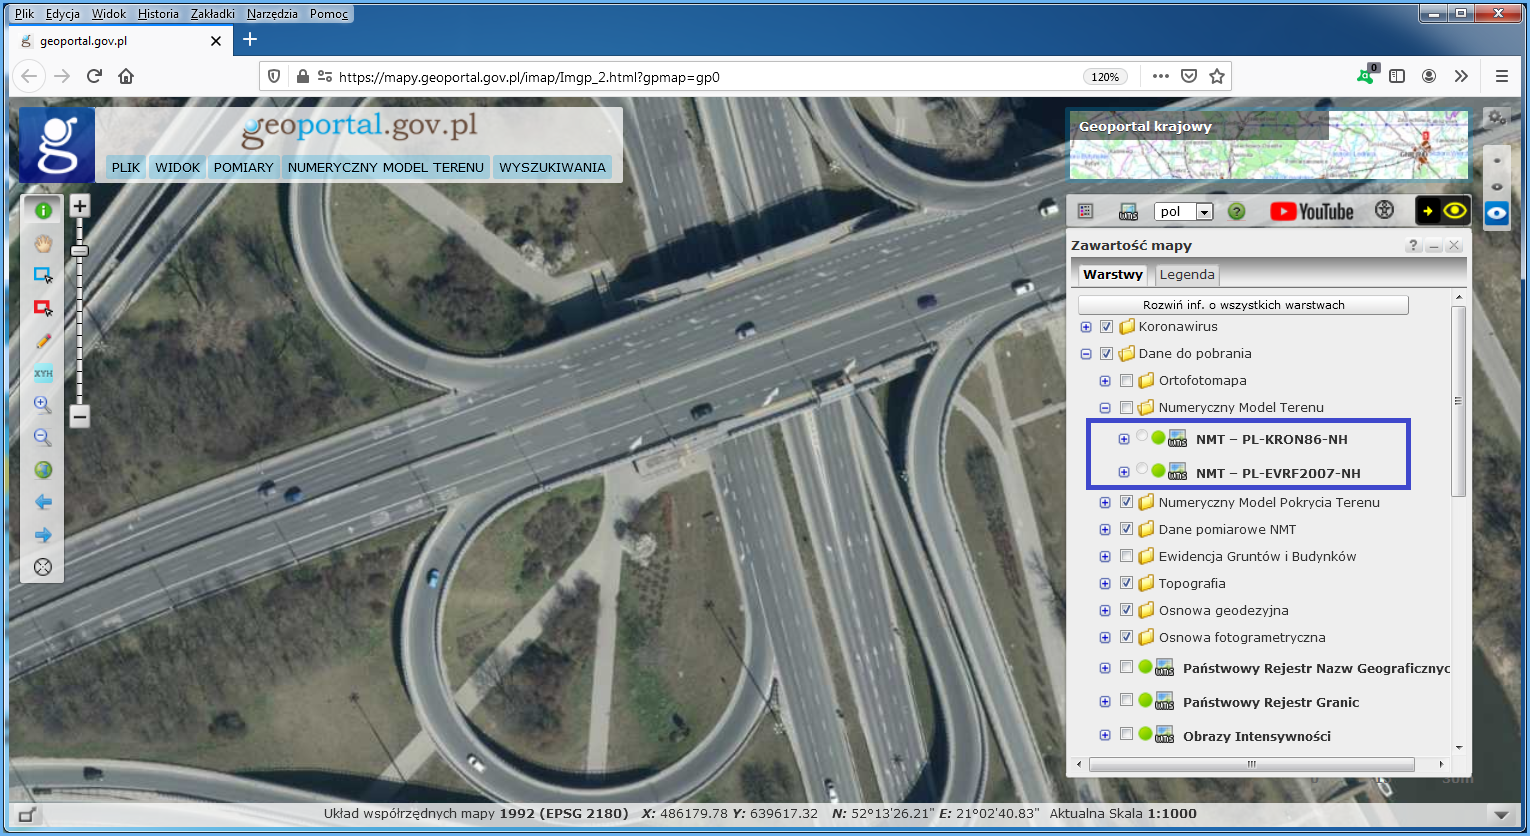
When you enable one of the specified layers and zoom in on the area of interest, you will see rectangles which represent DEM data sections. Click the area of interest to display the option to download the relevant file, as shown in Fig. 8.
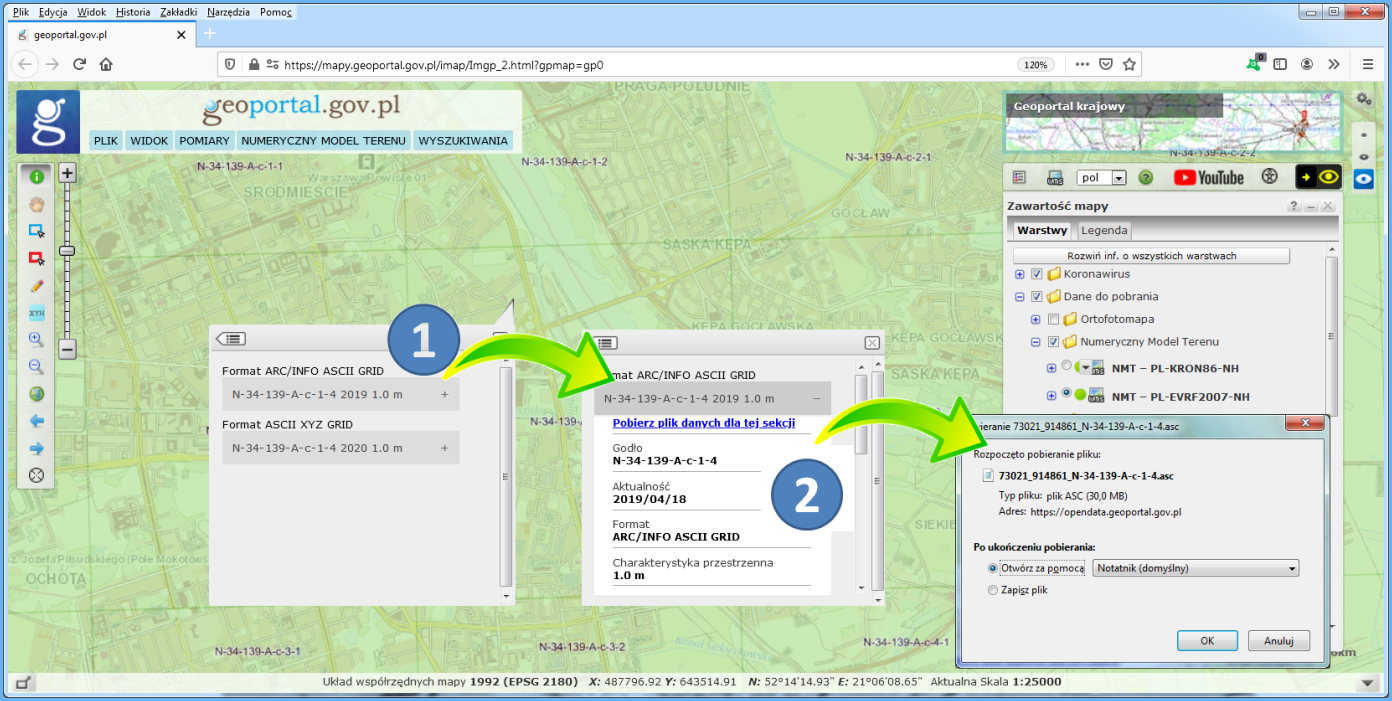
As a result, a file containing DEM data will be downloaded to your computer, and depending on your decision, displayed in the default application, as illustrated in Fig. 9.
DEM data at www.geoportal.gov.pl are downloaded via WMS, depending on the elevation system:
- https://mapy.geoportal.gov.pl/wss/service/PZGIK/NMT/WMS/SkorowidzeWUkladzieKRON86
- https://mapy.geoportal.gov.pl/wss/service/PZGIK/NMT/WMS/SkorowidzeWUkladzieEVRF2007
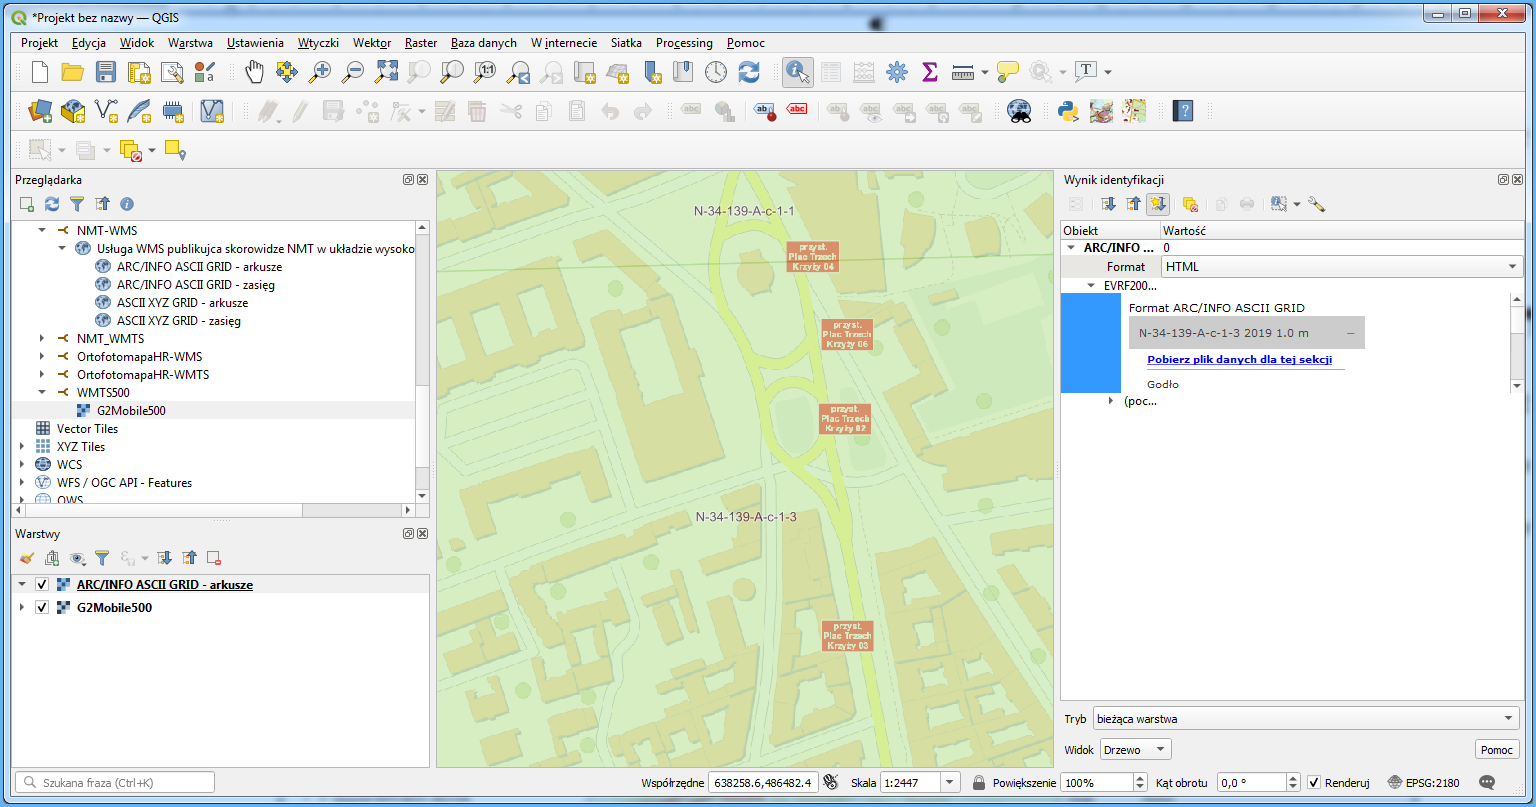
a Specifically, the GetFeatureInfo feature is used for this. It shares a link to download the relevant DEM data file as an attribute in the clicked location. If you connect these services to QGIS or other software, you can use such software to directly download DEM data (Fig. 11).
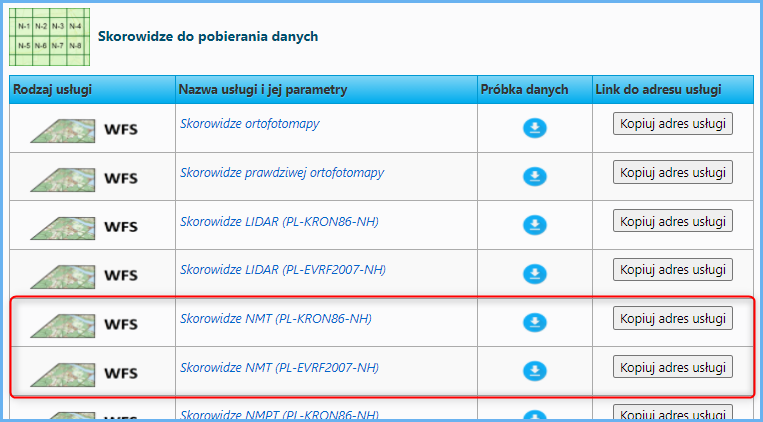
An alternative way to download DEM data is to avail yourself of WFS services (Fig. 12) used to present indexes of the Digital Elevation Model (DEM) available in the National Geodetic and Cartographic Resources.
- The first one presents the DEM per particular years (from 2000 to 2019) in the PL-KRON86-NH elevation system in every available format. It can be accessed at:
https://mapy.geoportal.gov.pl/wss/service/PZGIK/NumerycznyModelTerenuKRON86/WFS/Skorowidze
- The other one presents the DEM per particular years (from 2018 to 2020) in the PL-EVRF2007-NH elevation system in every available format. It can be accessed at:
https://mapy.geoportal.gov.pl/wss/service/PZGIK/NumerycznyModelTerenuEVRF2007/WFS/Skorowidze
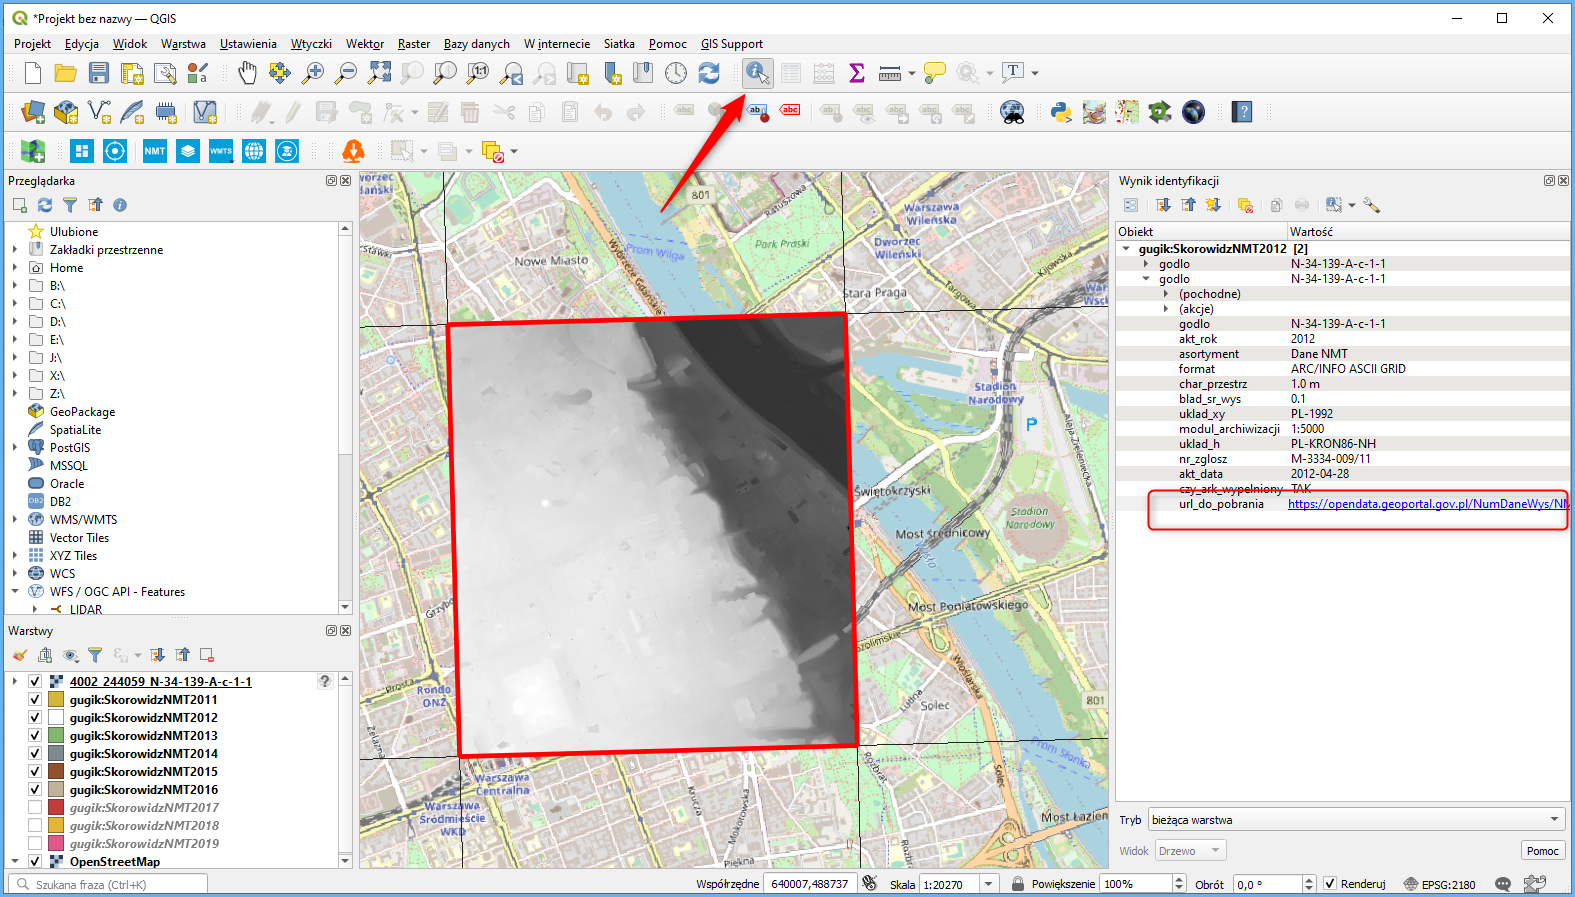
You can download DEM indexes using any software that supports a WFS client feature, such as QGIS. You can easily download each DEM sheet from the displayed sheet index. This operation is supported by the „Informacja o obiekcie” (About object) tool. When you click the selected sheet, it will display its metadata, including „Link do pobrania” (Link for download) that you can use to download DEM measurement data (Fig. 13).
The service makes it easier to download the DEM for larger areas, and soon similar WFS services will be implemented for other resources.
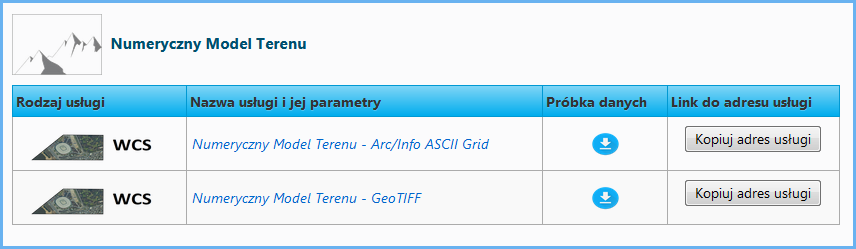
Another way to download the DEM is to use WCS services whose URLs are published on www.geoportal.gov.pl:
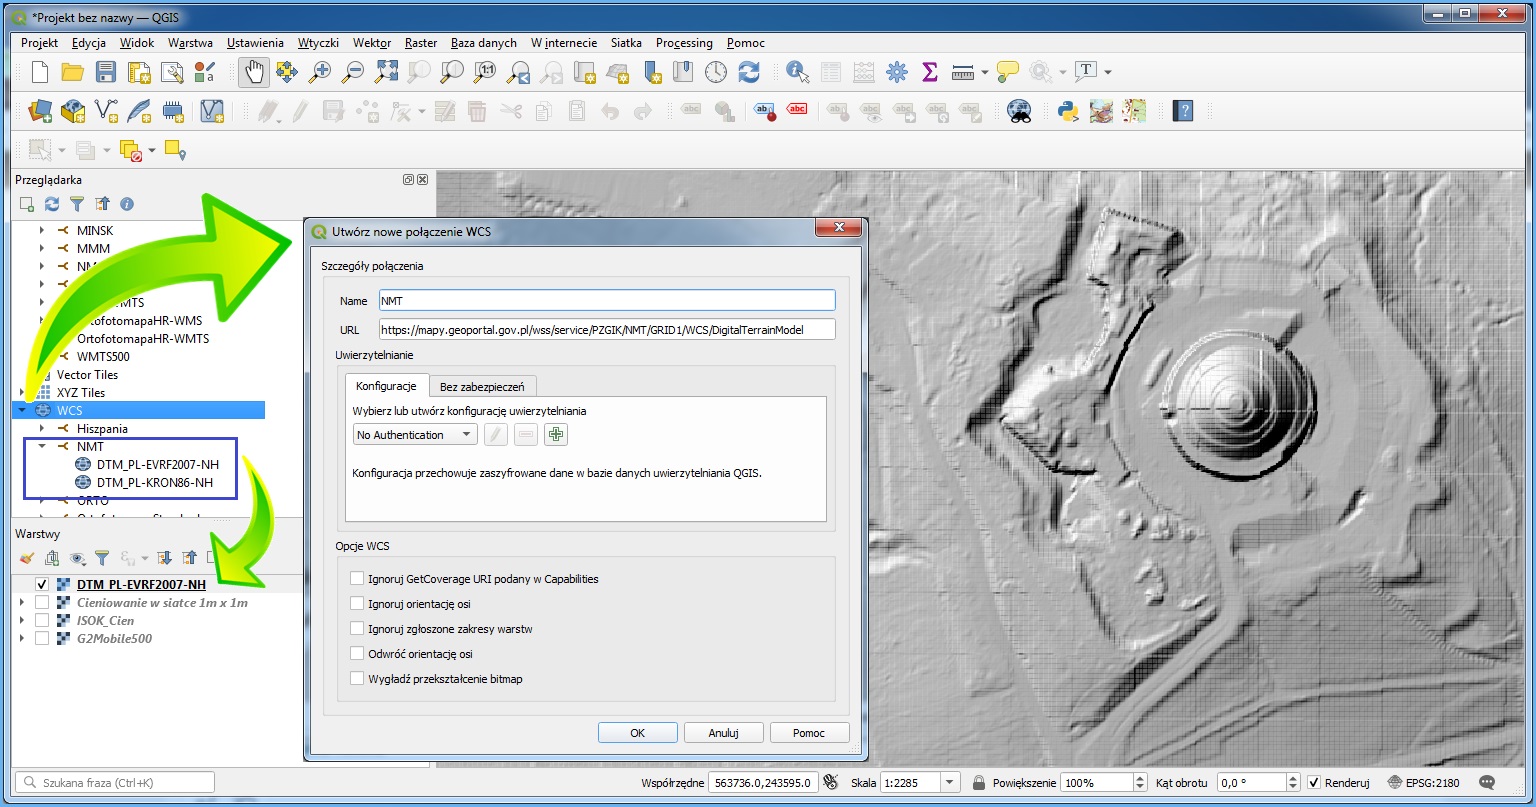
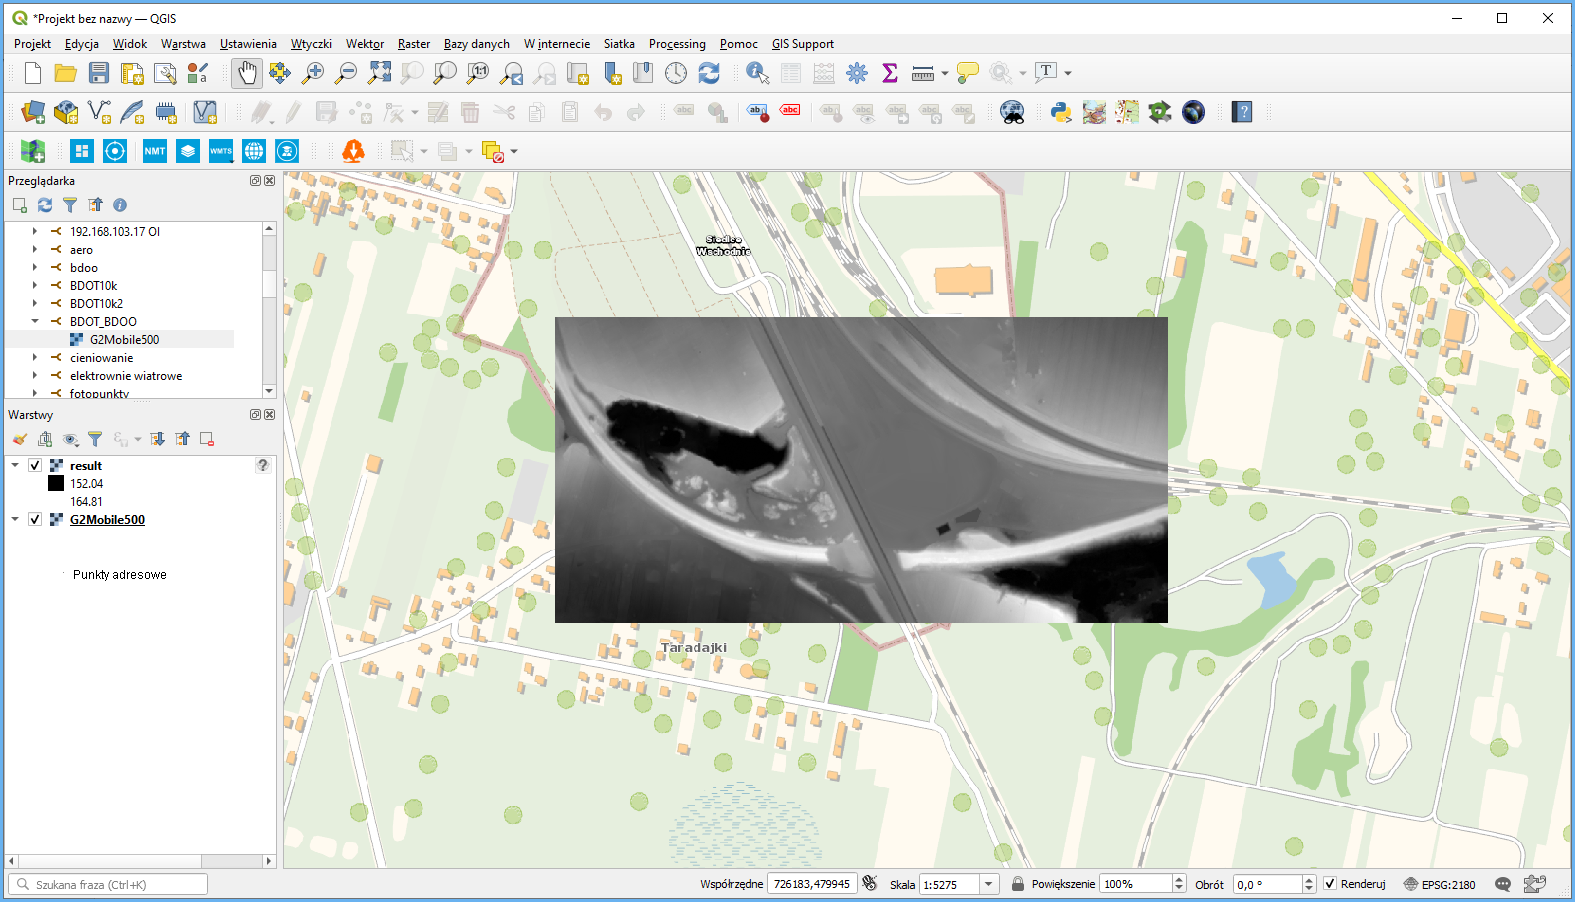
The most convenient way to use WCS services is to connect them to QGIS as a data source, as shown in Fig. 15.
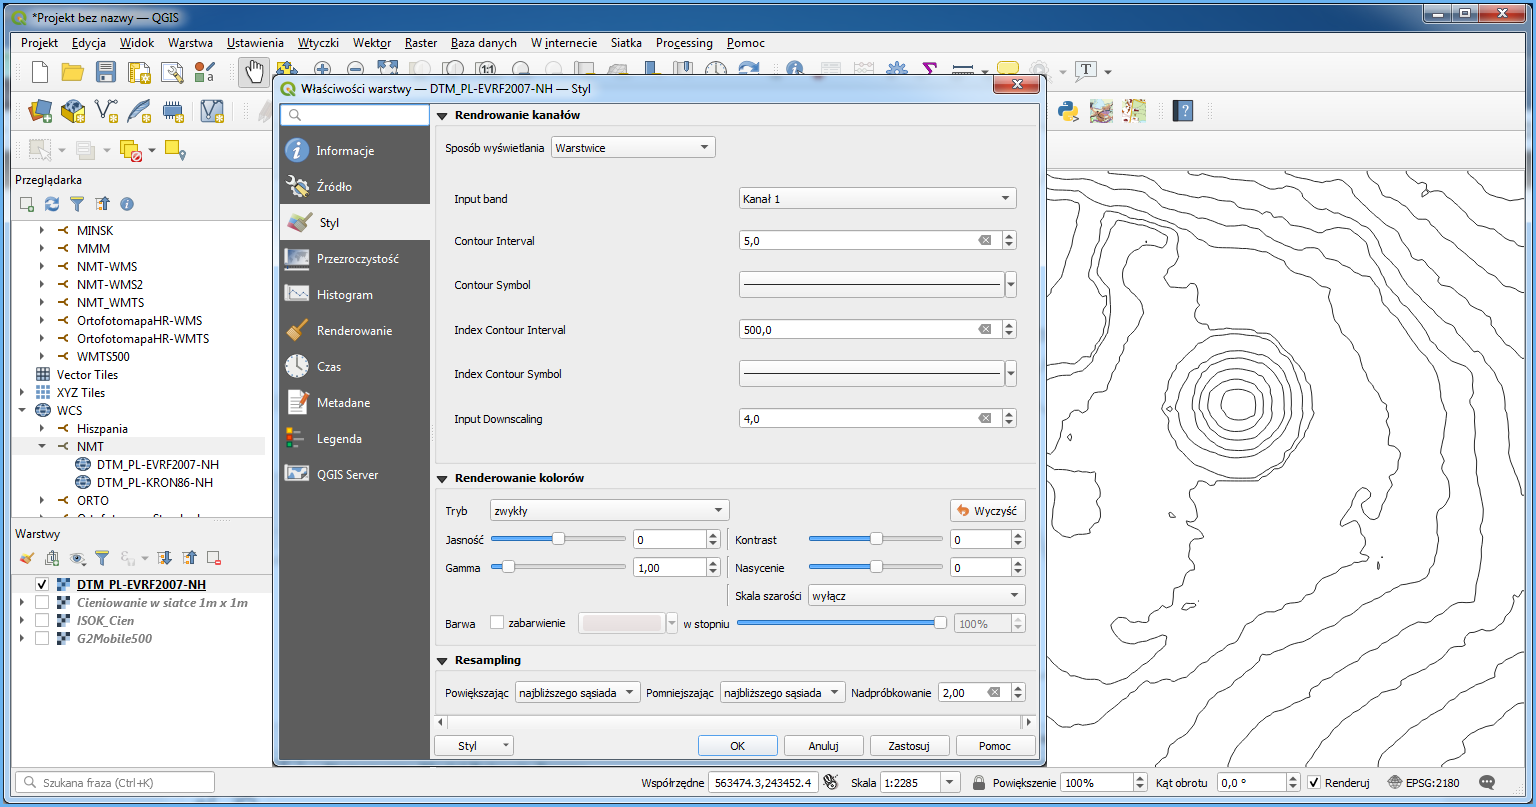
When you create a layer in a QGIS project, the service generates a DEM image for the displayed area per the parameters specified in layer styles.
Use the export option illustrated below to save a fragment of the DEM as a file.
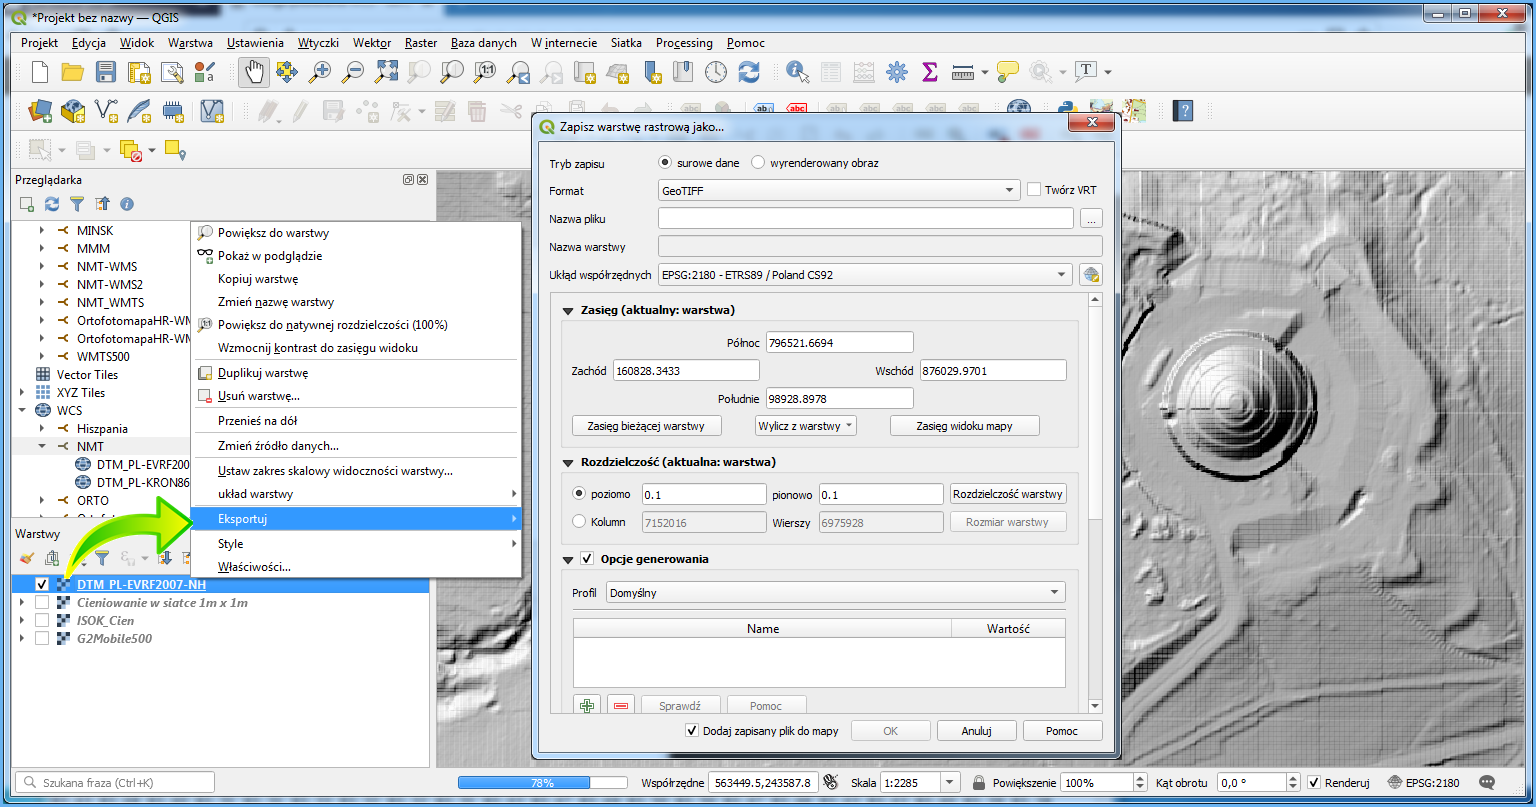
As a result, you get a local file consistent with the settings which represents the respective fragment of DEM raw data or rendered image. For technical reasons, in WCS, the area available for a single download is limited, but the service is suitable for downloading fragments corresponding to around a dozen of original DEM sheets.
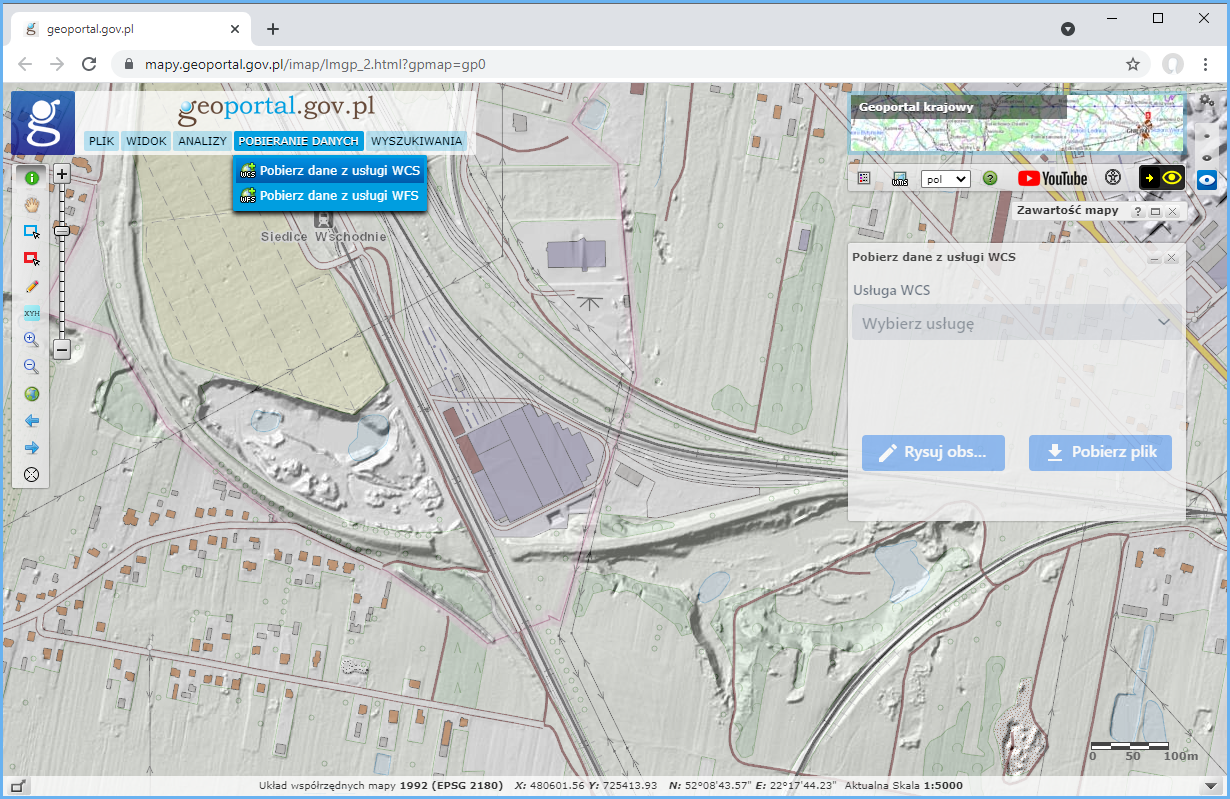
DEM can be also downloaded via WCS directly from www.geoportal.gov.pl using the „Pobierz dane z usługi WCS” (Download data from WCS service) tool. You can find this functionality on the toolbar in the left part of the map application user interface, as illustrated below.
To download data click the tool icon, select the data for download in the displayed pane or select a spatial range on the map (max. 10 km2), as shown in Fig. 19.
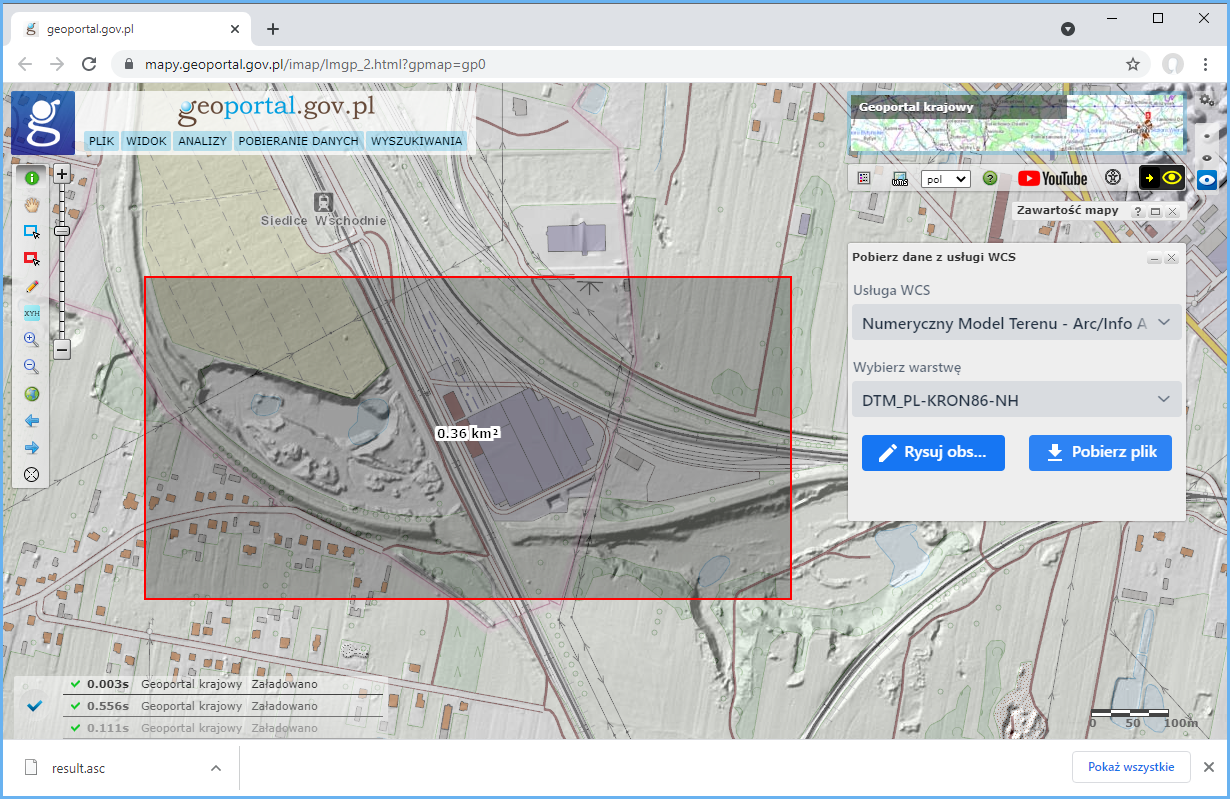
Afterwards, all you have to do is download the prepared data file:
The tool is particularly useful when the area of interest covers e.g. four sheets and, if downloaded in the conventional manner, would yield four sheets that you would have to put together. By using the functionality provided, you can quickly download a ready-made fragment, no matter what the source data sheet arrangement is.